The Quantitative Marketing and Structural Econometrics Workshop hosted this month at Washington University attracted 153 PhD students and faculty from across the country who create complex models to dice and slice big data sets for research in the areas of marketing, economics, and operations.
The workshop’s goal is to prepare PhD students for the rigors of research in the academic job market, according to Olin’s Raphael Thomadsen, associate professor of marketing and co-organizer of the gathering.
“We saw many students going into the job market with supposed ‘structural’ papers which were not meaningfully structural at all,” said Thomadsen who created the workshop in 2010 with Brett Gordon, a professor at Kellogg School of Management.
“Rather, these papers had very complex models that were often not identified by the data. Further, many people ran structural models without understanding what benefits a structural model might bring.”
Zhenling Jiang, a PhD student at Olin, attended the workshop for a second time this July. She is preparing to go on the marketing job market in Summer 2018. According to Jiang, “It was hugely helpful for my PhD study. The workshop brings thought leaders in the field to share their experience and state-of-the-art techniques to students. Each topic is taught by someone who is highly experienced in the area.”
The workshop is intended for PhD students in marketing, economics, or related business disciplines who have completed at least two courses on microeconomics and econometrics. So, as you would imagine, I needed her help translating the subject for this post.
Basics of Structural and Non‐Structural Analysis
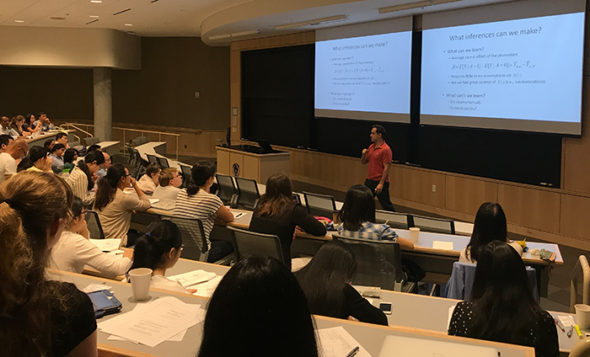
Thomadsen kicked off the workshop with the basics, as depicted in this chart:
Descriptive statistical analysis I understood, but models were new to me.
So I asked Jiang to explain: “Theory-based models draw on analysis of theories about how agents behave. The model could come from economic theory or psychology theory. For example, consumers maximize their utility or firms maximize profit. The structural model describes how agents make decisions, and this results in the observational data being generated from agents behaving according to the model (i.e. the data generating process).
“By getting the ‘primitives of the model,’ effectively we know how agents will behave. The powerful thing about structural models is that you can simulate what agents’ behavior will be like under a different situation (counterfactual analysis) that is not observed in data.”
Her explanation was helpful, but still a little beyond my comprehension. Another presentation takeaway was reassuring, “Structural need not be complex, and complexity does not mean structural.” But then came the next presentation.
Model-Free Evidence and Structural Models
Professor Brett Gordon led the students through a marketing problem about a digital advertising campaign for an online retailer. How did exposing consumers to an online ad (with a $10 discount code) affect sales? He explained that descriptive analysis—model-free evidence—should motivate a structural model.
Then, by applying a structural model to the observational data, one can make predictions beyond the observed data. For example, what would sales be if free shipping were offered?
Answering questions like this is why we need PhDs in marketing.
According to Thomadsen, the workshop has two types of sessions: philosophical and technique. “For the philosophical sessions, we want students to understand that when one estimates a structural model (or any model, really), one needs to think about the data generating process behind it. If one cannot identify what variation in the data links the data to the parameter estimates, then one needs to either get better data or use a different model.
“For the technique sessions, we discuss how to estimate demand, how to solve models with dynamics (where the choices you make today affect the tradeoffs you face tomorrow), estimate game theory models (where the choices one person/firm makes affects the payoffs of another person/firm, and vice versa), and new machine learning techniques.”
Note: The Quantitative Marketing and Structural Econometrics Workshop was hosted at Washington University on July 17-19, 2017. Previously, Thomadsen co-organized this workshop with Brett Gordon of Kellogg, and Rick Staelin of Duke University. The workshop was held at Duke’s executive center in 2010 and 2013 and at Kellogg’s Allen Center in 2015. Attendance has ranged roughly from 95 – 130 students and faculty in the past years, not including the organizers and presenters.
Technology is changing the landscape of supply chain at a breakneck pace, and organizations that are able to stay ahead of the curve often enjoy a significant advantage over their industry competitors. Digitization, cloud computing, big data, Internet of Things, and artificial intelligence are all major factors in shaping operational strategy. These manufacturing innovations have given rise to a trend dubbed Industry 4.0.
John Stroup, President and CEO of Belden Inc., paid a visit to The Boeing Center to share his wealth of knowledge, and to give a brief history of Industry 4.0, aka the Smart Factory. He explained that Industry 4.0, a term coined in Germany, is the fourth major iteration in manufacturing processes. “‘Smart Manufacturing,’ ‘Intelligent Factory,’ and ‘Factory of the Future’ all describe an intelligent, flexible, and dynamic production facility, where machinery and equipment will have the ability to improve processes through self-optimization and autonomous decision-making,” said Stroup. The major improvements from 3.0 to 4.0 are the ability to automate complex tasks (even remotely) and the access to data across the whole supply chain that allows for greater flexibility and connectivity.
Stroup went on to discuss the key characteristics of the Smart Factory and how innovations in digital technology have improved existing business models and enabled new ones. Such innovative technology allows for improved productivity, flexibility, and decision making, all of which benefit manufacturers and consumers alike.
For more supply chain digital content and cutting-edge research, check us out on the socials [@theboeingcenter] and our website [olin.wustl.edu/bcsci]
This story, written by Kurt Greenbaum, originally appeared in the 2016 edition of Olin Business Magazine.
Buried in millions of lines of customer data collected from scanners, cash registers, patient records, online product reviews, wearable devices, and other sources, businesses in every industry are unearthing profit-generating insights unknowable just a decade ago.
Click to read the story in Olin Business Magazine.
Those insights range from the seemingly inconsequential—promoting beer actually increases the sale of diapers—to the staggering: creating cost-saving hospital systems to more efficiently pair nurses with incoming patients.
A recent survey of 422 European and US executives by the Economist Intelligence Unit and Cognizant ranked big data analytics as the most important digital competency businesses will require by 2018. That puts big data skills ahead of security, mobile technology, and digital marketing. While demand will be high, US supply for analysts is expected to lag: McKinsey & Company forecasts a shortage of 140,000 to 190,000 analysts two years from now.
“They want more than nerds,” said Gregory J. Hutchings, Senior Advisor in Olin’s Weston Career Center. “They want people who can look at the data and draw quantitative and qualitative conclusions—and make strategic recommendations.”
Olin graduate Siri Zhan (MSCA ’16) has already experienced business’s hunger for talent. She started working for New Jersey-based Dressbarn as an analyst two months before receiving her degree.
“My manager told me they had the position open for six months without finding a qualified candidate,” said Zhan,who prepares monthly forecasts for sales promotions based on previous customer data. Strategies for coupon-based promotions are individualized for loyal customers versus rare visitors who might be “reactivated” with a more enticing offer. Zhan and classmate Drew Kaplan (MSCA ’16) both spoke of blending their passion for math and technology with the art of marketing and business problem solving. Their interest led them to Olin’s customer analytics graduate program.
WashU’s program was attractive because it was part of the business school—not a separate tech degree. “I didn’t want to look at data and run statistical analyses just to do it,” said Kaplan, who analyzes customer data for UPS in Atlanta. “I wanted to be grounded in business principles and solve real problems.”
Blue chip companies across numerous industry sectors have grabbed up Olin grads like Zhan and Kaplan, including Bain & Company, United Airlines, Emerson, Penn National Gaming, and The Walt Disney Company.
“Big data is the new oil. The companies, governments, and organizations that are able to mine this resource will have an enormous advantage over those that don’t.” -Pew study on the future of big data
Learning to deal with data
The CCABD and the master’s program form a one-two punch designed to prepare students and aid industry leaders in dealing with the new technology-driven tidal wave of customer data. Through consulting projects managed by the Center for Experiential Learning, MSCA students get hands-on experience solving real-world business problems focused on big data analysis. The client companies benefit from cutting-edge analysis and gain access to top-flight research from Olin faculty members who serve as advisors on projects.
Kaplan was the student team leader on a consulting project that helped analyze data from a retail supply company. The team’s recommendations included a segmentation strategy defining how the company should market to different types of customers.
In one project, Kaplan exercised a variety of technical, analytical, and marketing muscles. He wrote database queries to clean up and consolidate 5 million rows of purchase history. He applied mathematical concepts to frame each customer’s behavior across a variety of product categories. And the student team created tools for the client to provide product recommendations and personalized marketing for its half-million customers.
“It was a big, big part of my curriculum and what I got out of the program,” Kaplan said.
Working on another semester-long project, Zhan’s team analyzed online customer shopping patterns. Her team found the experience and feedback rewarding, noting, “The client said some of our conclusions were actually very new to them.”
These experiential learning opportunities are just one facet of the CCABD. Seethu Seetharaman, W. Patrick McGinnis Professor of Marketing, is Director of the center and Academic Director of the master’s program in customer analytics. He also sees the big data boom as a perfect moment for collaboration between faculty researchers and companies of all sizes. “The big data movement is here to stay,” said Seetharaman. “The timing is right for us to inform and educate companies in this area.”
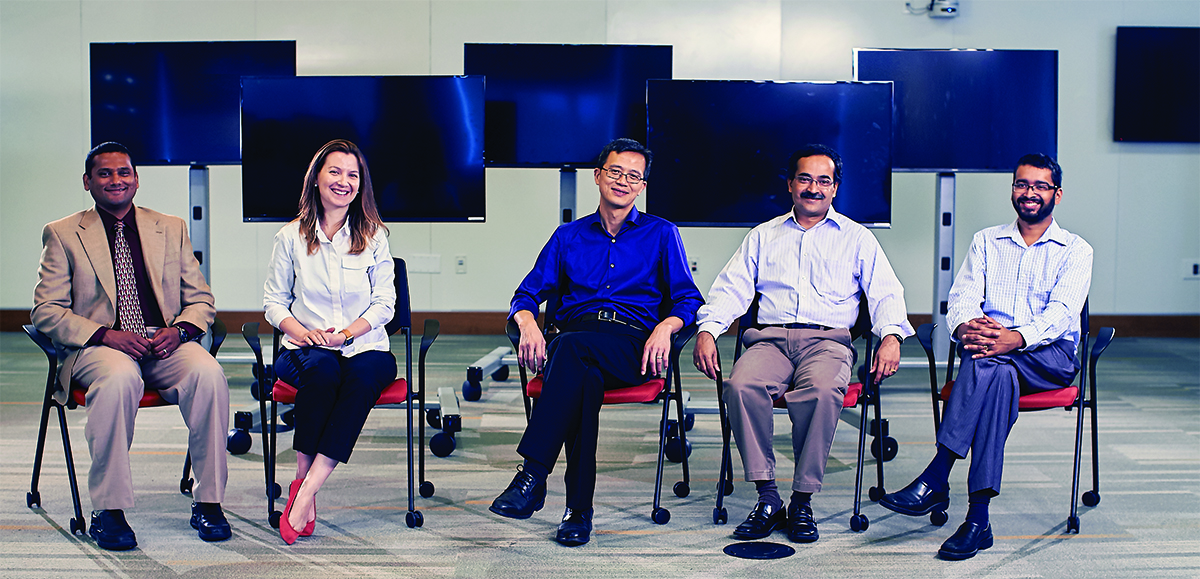
Some of the Olin professors involved in big data research and teaching, left to right: Durai Sundaramoorthi, Senior Lecturer in Management; Yulia Nevskaya, Assistant Professor of Marketing; Tat Chan, Associate Professor of Marketing ; Seethu Seetharaman, W. Patrick McGinnis Professor of Marketing; Arun Gapalakrishnan, Assistant Professor of Marketing
Data is gold mine for research
Both the master’s degree program and the big data center draw on cross-campus partnerships with the Technology and Leadership Center, the School of Engineering & Applied Science, Data and GIS Services, and the University Library. Faculty from a variety of disciplines partner or partake in research projects exposing the real-world and practical business applications of big data analysis.
“The data is exploding,” said Durai Sundaramoorthi, Senior Lecturer in Management, who has extensive experience in the healthcare industry. He teaches predictive analytics to MSCA students and shows them how to find unexpected relationships that can unlock sales strategies previously opaque to marketing professionals. “The human brain cannot process the relationship among so many variables.”
For example, that seemingly random link between beer and diapers illustrates the power of once invisible cross-category connections. “Analytics help to unearth these patterns from the data,” Sundaramoorthi explains. “Without analytics, we wouldn’t know these interesting cross-category relationships.”
These researchers bring concepts such as predictive modeling, probability analysis, and predictions about customer risk to the nitty gritty work of slicing and dicing the mega sets of data now available. Then they mine the results to create strategies for pricing, inventory, targeted marketing, and logistics that can drive company profits.
Sundaramoorthi’s research with a Texas hospital cross-referenced the minute-by-minute movement of nurses—using data from now-commonplace wearable scanners—with patient records, creating a cost-saving algorithm for nursing assignments.
“Slowly, companies are learning that data can be used to make themselves more efficient or more profitable,” Sundaramoorthi said.
One of Seetharaman’s recent research projects examined millions of purchases from a national grocery chain’s loyalty card database. Cross-referencing products purchased from 800 households in 28 categories over nearly two years, Seetharaman and his research partners looked at which coupon strategies would bump profits the most. The result: Coupon bundles around a theme such as “back to school” yield higher profits on a per-customer basis, but overall, a store can expect a 27 percent profit bump from coupons customized to individual customers.
Tat Chan, Associate Professor of Marketing at Olin, has researched a month’s worth of data from Chinese online retailer Taobao, tracking a million consumers and their online product search patterns. Through his research, he’s developed strategies for segmenting online customers as “high” vs. “low” value, and targeting them with coupons to encourage purchases based on their online searches.
“This data is about individual customer behavior,” Chan said. “And most companies don’t know how to use their data.”
Big role for big data center
That, too, is where the CCABD comes in. While professors prepare students with skills to analyze and interpret big data, the CCABD is exposing industry leaders to skills and concepts they’ll apply to big data problems in the real world.
Seetharaman has recruited an advisory board from companies as diverse as St. Louis-based grocery chain Schnucks, Express Scripts, and MasterCard.
He’s been careful to choose companies in noncompeting industries to facilitate a free flow of conversations about big data best practices and challenges, so executives are able to solve problems and suggest solutions jointly. For example, the discipline is so new, companies are struggling to figure out how to structure their analytics teams—centralized or dispersed? The center scheduled a big data conference on October 21 and plans semiannual “immersion training” sessions—two-day courses targeting business professionals who need grounding in big data principles. The first of those is expected in December.
“A lot of us need to dust off our skill sets,” said Justin Krieger, Analytics Manager with Wells Fargo’s Wealth and Investment Management Division, which holds an advisory board seat. “There’s still a lot to be learned about crunching through a billion records.”
Statistics are becoming a competitive necessity for companies large and small. No longer the domain of a few back-office analysts, companies today require statistical knowledge as part of a well-rounded analytical background. That’s where QBA121 – Managerial Statistics II – comes in. In the course, we develop the foundational skills for statistical analysis, primarily regression modeling.
In a world surrounded by Big Data opportunities, students need to be comfortable with statistics and have the tools to analyze data to develop managerial recommendations.
The QBA121 project does just that. It allows students to explore and analyze data that interests them. The poster session gives them an opportunity to display their insights to a broad audience. Their projects reflect both their interests and the competencies they mastered during the course. Most of the students applied regression analysis to gain insight on a topic they were knowledgeable about. Statistics allowed them to expand their knowledge while grounding insights in data, rather than conjecture. In many projects initial hypotheses were only partially supported, and the data determined that multiple factors impact the dependent variable.
During the course we learned why statistics is a foundation in so many disciplines in academia. It can be applied to diverse topics that students will explore in their academic journey. Similarly, the topics chosen for the course project reflect the diversity of students’ interests.
Movies were of interest this past semester, with students identifying which movie awards are best predictors of Academy Award nominations; how a book’s genre and the author’s productivity impact a movie’s success; and which factors are effective predictors of Best-Actor Oscar Nominations.
Crime statistics make for effective, if not particularly uplifting, projects. Here we learned how education, poverty, population density, and law enforcement impact local crime. We also found out that the key factors determining a city’s crime index are assaults, rapes, and larceny.
Finally, sports frequently generate a lot of interest in the class. Every Monday-morning coach wants to know why his team isn’t living up to their expectations. For those that want an in-depth look at college basketball, we have some advice on which teams will succeed in “March Madness”.
To see a sample of the projects presented, please view the Spring 2016 poster session book, click here.
Please join us next semester as we showcase projects from another talented cohort.
Guest blogger: Eli Snir, Senior Lecturer in Management
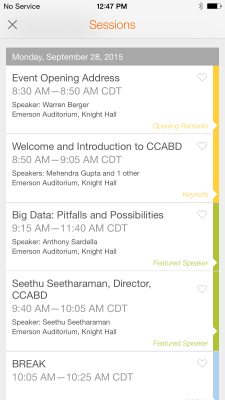
Center Director and W. Patrick McGinnis Professor of Marketing Seethu Seetheraman formally launched the Center for Customer Analytics and Big Data (CCABD) at it’s launch event titled, “Big Data Dilemmas & Little Data Discoveries: Understanding the Data-Driven World & its Outcome Value to Your Business” on Monday, September 28 at Emerson Auditorium in Knight Hall. In his opening remarks, Seetherman explained that the CCABD was created to work toward greater understanding of the data driven world. “Why customer analytics? Because we have to determine which is the right model to solve the business problem, and to take advantage of existing knowledge of the problem and solutions.” He also provided a now commonplace definition of Big Data, which is characterized by Volume, Variety and Velocity.
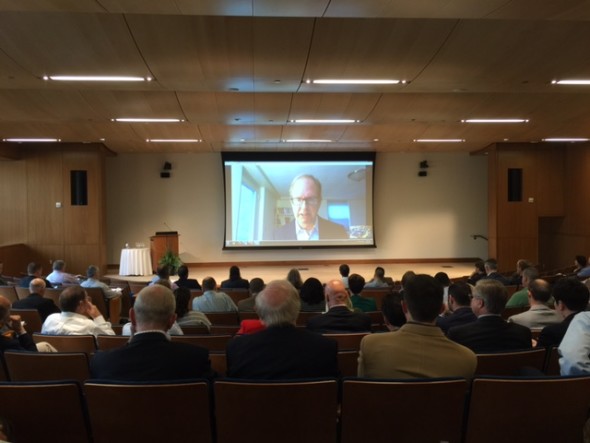
Warren Berger, author of A More Beautiful Question: The Power of Inquiry to Spark Breakthrough Ideas contributed to the introductory remarks via Skype (photo above), by encouraging the audience made up of professionals, students and faculty to be persistent in asking fundamental questions such as “Why?”, “What if?” and “How?” in business and with data. He said, “Questioning is an app we are born with. It begins to manifest itself at a very early age. Between the ages of 2 and 5, kids ask 40,000 questions. As we get older, we become less inclined to question everything. More inclined to accept things at face value. If you do this in business, you’re not going to be innovative.”
Event Agenda appeared on the Event App by Bonfyre.
Speakers at the event included a wide range of data experts from small companies such as Evolve 24 and Alix Partners, and large companies including Boeing and IBM.
In addition, Laura Tellman, EMBA 43 and Director Clinical Informatics at BJC Healthcare delivered a presentation called “Accelerate Analytics with Data Governance” on how organizations can begin the daunting task of building a practice to govern their data.
Event attendee Victoria Busch is in Communications at Ameren Illinois and is on the Advanced Metering Project.
Victoria Busch of Ameren Illinois.
She said, “Big Data is really important to us because we’re trying to make sure that we can build those relationships with our customers, to interact with them better, and provide them better self service tools. We’re using customer segmentation to help drive this effort and we want to make sure that we’re using the right data to communicate with the right customer with the right message.”
Jean Shuler and Brian Lawton of Washington University Information Technology (WUIT).
Brian Lawton and Jean Shuler, both of Washington University Information Technology (WUIT) also attended the event and are eager to bring the advantages of understanding big data to the IT organization. Brian said, “I’m here to try to find ways to help build internal user communities around big data.” Jean added, “I’m trying to work with our internal clients as well, trying to help them figure out how to look at their data and be able to make effective decisions with it. This is a way to get ahead of the curve and have more insight into what can be accomplished instead of just getting the data together, but figuring out how to break through it.”

 “We saw many students going into the job market with supposed ‘structural’ papers which were not meaningfully structural at all,” said Thomadsen who created the workshop in 2010 with Brett Gordon, a professor at Kellogg School of Management.


 Answering questions like this is why we need PhDs in marketing.
 According to Thomadsen, the workshop has two types of sessions: philosophical and technique. “For the philosophical sessions, we want students to understand that when one estimates a structural model (or any model, really), one needs to think about the data generating process behind it. If one cannot identify what variation in the data links the data to the parameter estimates, then one needs to either get better data or use a different model.